{LogoClim}: WorldClim in NetLogo (2.1.0)
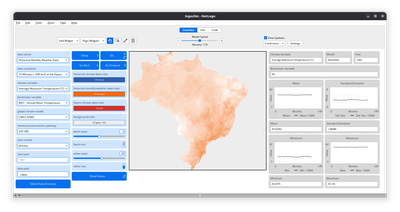
LogoClim is a NetLogo model for simulating and visualizing global climate conditions. It allows researchers to integrate high-resolution climate data into agent-based models, supporting reproducible research in ecology, agriculture, environmental sciences, and other fields that rely on climate data.
The model utilizes raster data to represent climate variables such as temperature and precipitation over time. It incorporates historical data (1951-2024) and future climate projections (2021-2100) derived from global climate models under various Shared Socioeconomic Pathways (SSPs, O’Neill et al., 2017). All climate inputs come from WorldClim 2.1, a widely used source of high-resolution, interpolated climate datasets based on weather station observations worldwide (Fick & Hijmans, 2017).
LogoClim follows the FAIR Principles for Research Software (Barker et al., 2022) and is openly available on the CoMSES Network and GitHub. See the Logônia model for an example of its integration into a full NetLogo simulation.
Release Notes
- Added a
#headless?parameter to thesetupprocedure for improved headless execution. - Removed the
#tickand#waitparameters from thegoprocedure; it now has no parameters, simplifying execution. - Updated the
go-backprocedure to reset ticks and clear all plots. - Converted
NaNvalues produced by the GIS extension (used to represent missing data) intofalse, following Seth Tisue’s suggestion. This fixes problems with primitives such asexport-worldandimport-world(see GIS Known Issues). - Converted string parameters and interface text to title case.
- Improved the
show-valueprocedure to provide better contrast for patch labels. - Added a 12-month moving average for patches. Patches now have two additional attributes:
value-12(last 12 months of values) andvalue-12ma(12-month moving average). - Updated plot behaviors: added a 12-month moving average pen, added indicators for the start of each 12-month cycle, and y-axis now dynamically adjusts based on the minimum, maximum, and interquartile range of the 12-month data window.
- Removed the
haltprocedure; error messages now provide more descriptive text. - Added the
Logôniamodel as a reference forLogoClimintegration. - Updated Quarto notebooks.
- Updated documentation to reflect all changes.
Associated Publications
A manuscript describing the model has been submitted to the Journal of Open Source Software (JOSS) and is currently under review.
This is a companion discussion topic for the original entry at https://www.comses.net/codebases/bccd451f-76a4-408a-85fd-c5024359ba9a/releases/2.1.0